
case study
SaaS/Data Visualization
project:
Waggle Student Growth Report
2016
PROJECT SUMMARY
Create an easy to comprehend report of student performance over time to show skills/standards growth, from school-wide subject level down to a specific student, illustrating trends and providing suggested next steps.
MY ROLE
PRODUCT MANAGEMENT:
Product Strategy, Cross-Functional Team Collaboration, User Stories, Prioritization
UX DESIGN:
Wireframes, Prototype, Visual Design, User Workflow Optimization
ABOUT THE TEAM
I worked with the VP of Digital Curriculum, Director of Digital Content Development, VP of Engineering, Technical Lead who managed the off-shore developers, Business Analyst, and Visual Designer. I also formed an advisory panel consisting of a school district curriculum directors and teachers who represented the target users.
CHALLENGE
Waggle Practice™ is an award-winning smart practice SaaS platform that helps students in Grades 2-8 with individualized Math and English Language Arts practice.
For the initial MVP release, the focus was to provide a reporting tool that allowed school districts to extract student performance data from the platform in order to compile it with data from other systems. The report was made available to teachers since they wanted to view class and student performance.
The goal for the next release was to introduce an intuitive design that would increase teacher usage and improve student outcomes.

Sample of the original Waggle Growth Report Export
DESIGN PROCESS
PROJECT GOALS:
-
Lower or eliminate additional user training
-
Increase Teacher usage by helping them identify skills, standards, and students that require additional instruction and practice
-
Increase District Admin usage by providing a way to quickly identify standards that require support at the grade or class level
Through customer interviews of teachers and curriculum directors, we heard:
Research &
User Interviews
Ideate &
Sketch
Wireframe &
Prototype
User Test
BUILD & IMPLEMENT
Iterate

RESEARCH & USER INTERVIEWS
I established an advisory board of teachers and district curriculum directors to conduct interviews, validate requirements, and provide feedback on possible solutions.
Here is what we heard:
CRITICAL FEEDBACK:
-
Reports weren't ready on demand due to the volume of data exported, it was necessary to schedule the downloads to not effect platform performance
-
Overwhelming and hard to decipher spreadsheets since it was primarily designed to be a data source to be utilized with someone familiar with data analysis
-
Unexpected and seemingly erroneous reports, if the reporting criteria were not set correctly
NEEDED:
-
Product Efficacy - were student skills/standards improving with product use
-
FERPA Compliant - (Family Educational Rights and Privacy Act) limit access to student performance data to authorized teachers
-
Surface Trends and Actionable Suggestions - provide data insights and suggest relevant supporting content

IDEATE & SKETCH
With the information collected during the research phase, I led the project team through creating user journey maps for several scenarios, which included:
-
Initial school set-ups
-
Automated syncs
-
Manual syncs
-
Error Handling / Recovery
We sketched out possible solutions and vetted them internally for technical feasibility.


WIREFRAME & PROTOTYPE
I created high-fidelity wireframes to address each of the identified user flows which I then used to create a prototype. Typically I would start with low-fidelity but because this was a quick turnaround project and we had limited time with our advisory team I wanted to simulate the experience as best as possible.

I produced the wireframes with Sketch and the Prototype with InVision

USER TESTS
Our advisory team was spread across the country so we conducted our user testing through Skype with an outline of the key questions we wanted to ask. One key insight we learned from the IT administrator was that they had no idea how the data was being used downstream which was resulting in updates being pushed during prime usage hours. This led me to develop onboarding and support material with best practices and a high-level overview of how the data was being utilized on the Learning Platform.
BUILD & IMPLEMENTATION
CUSTOMER SUPPORT TEAM EXPERIENCE

Email Notifications
Once schools are set up successfully automated nightly syncs are initiated. We knew that the primary users of our Roster Management Tool would not routinely login to monitor the syncs which typically would be fine until it wasn't. We developed email notifications that would be sent daily to a distribution mailbox to the support team with an "at-a-glance" digest report of the previous night's sync. I developed procedures with them on how to handle corrective action and customer communications.


Customer Support Dashboard
The customer support dashboard was designed so support would see immediately syncs that needed intervention and confirmation of successful syncs. They also had search and filter functions to zoom into a specific district or school to troubleshoot and support customers.
Card 1: Count of new school setups

Card 2: Count of suspended syncs

Card 3: Count of sync errors

Card 4: Count of successful syncs

SCHOOL TECHNICAL ADMINISTRATOR EXPERIENCE
Email Notifications
We developed email notifications for School District Admins since they are providing support for hundreds of applications in their district, it was critical to provide push notifications when something required their attention. Since they aren't a frequent user, the experience needed to be streamlined and provide clear, succinct, and informative messaging.

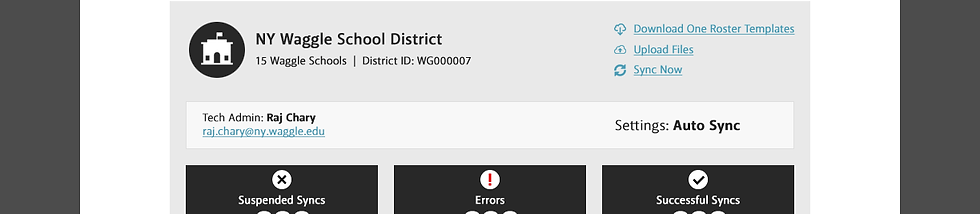
School Technical Admin Dashboard
The primary use cases for the School Technical Admin Dashboard are:
-
Initial Setups
-
Troubleshooting
We purposely developed a one-page "control panel" design that would allow them to view status, available functions, and contextual help quickly.
Tab 1: Number of Licensed Seats

Tab 2: Status of School Syncs

Tab 3: SFTP Settings

Tab 4: Custom field mapping setting

Tab 5: Custom username & password settings

TAKEAWAYS
There were several key takeaways from this project:
-
Doesn't matter how great your product is, if a user can't get in or if they lose trust in the data you risk losing a customer
-
Advisory Boards are not only a great resource for product development, it helps keep the team connected to the real-world needs of the customer.
-
Having a clear MVP plan up front helped to keep the team laser focused on optimizing the reliability of the solution
